This video is a talking head with Nick Pontefract, chief strategy officer for Sport England, speaking over animated graphics detailing the latest Active Lives Children and Young People Survey results, published by Sport England on 4 December 2025.
He’s pictured in front of a white background, with a blue border around the bottom and right sides of the screen, with the Sport England logo in white in the top right hand corner.
Writing in italics is Nick’s speech, writing not in italics is description of what’s going on, on screen.
The video is set to a generic backing track.
Active Lives Children and Young People Survey 2024-25 Explained appears on the screen in blue writing.
The text shrinks to the top right corner, an animated version of the report, with pages turning, appears beneath it, and Nick’s name and title appear beneath him on screen.
The good news is activity levels are the highest they have been since we started the survey back in 2017.
The text and animated report leave the screen as blue arrows move up the screen behind Nick.
We’re not just bouncing back from the pandemic — we’re seeing real progress beyond recovery.
The words ‘real progress’ appear on screen in large green font, in front of Nick.
Similarly, the proportion of children and young people who are less active is lower than we’ve seen before.
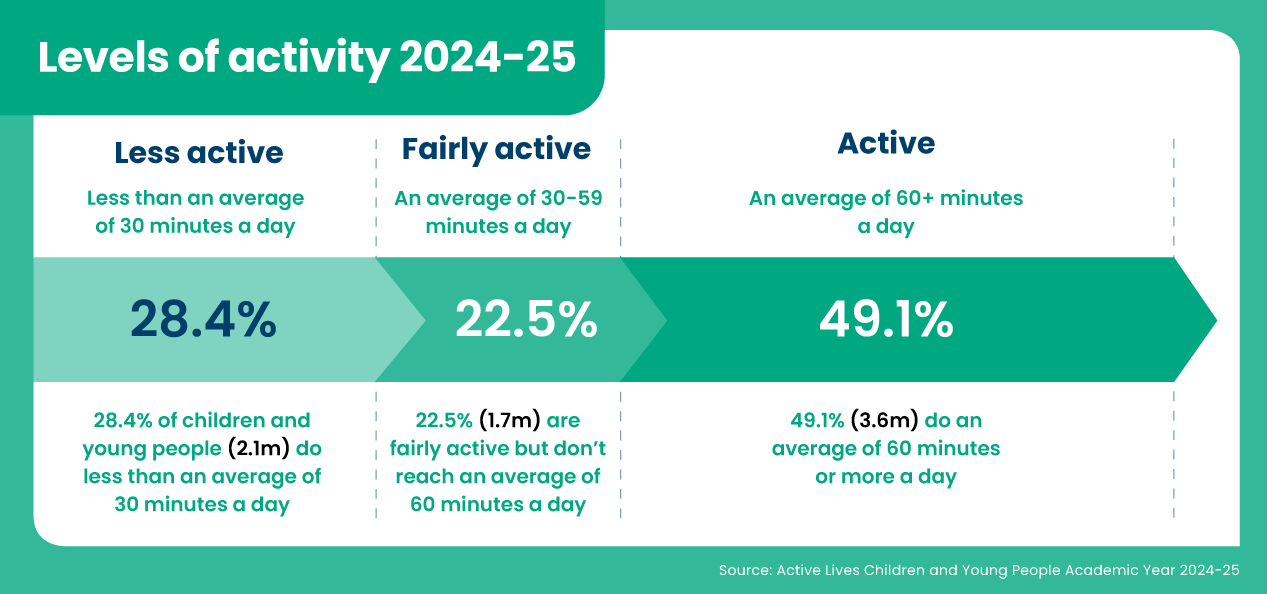
Nick moves to the left of the screen and a pie chart detailing levels of activity appears on the right. The figures read:
Less active – 28.4% (less than an average of 30 minutes a day)
Fairly active – 22.5% (average of 30-59 minutes a day)
Active – 49.1% (average of 60+ minutes a day
The ‘less active’ portion of the pie is highlighted and a downward arrows appears with -1.1% in it.
However, this needs to be seen in context, only 49% of children are meeting the Chief Medical Officer’s guideline of an hour (on average) of exercise per day across the week.
The pie chart slides off screen to the right, replaced by a line graph showing the percentage of ‘active’ children and young people (average of 60+ minutes a day) since 2017-18. The highlighted numbers show 43% in 2017-18 and 49% in 2024-25. This is accompanied by an upward arrow on the right, with +1.3% in it.
And while this is higher than it’s been before, we still have more to do when more than half of young people aren’t active enough.
Looking into more of the detail now. We’ve seen a small increase in activity levels for both boys and girls over the last year, building on the longer term increases we have already seen.
The line graph slides off to the right, replaced by a bar chart comparing levels of activity between boys and girls.
In 2023-24 it shows a green bar for girls at 45% and a red bar for boys at 51%. These bars are overlaid with figures for 2024-25, with 46% for girls and 52% for boys. Arrows show these are up +1.6% for girls and +1.1% for boys.
Both more recently and over the longer term, the increases are slightly greater for girls than boys. As a result, the gender gap between boys and girls is slightly narrower than the gap recorded both last year and when the survey began.
The bar chart is replaced by a line graph showing changes over time for the boys and girls percentages. The highlighted numbers show 40% for girls and 47% for boys in 2017-18, and 46% for girls and 52% for boys in 2024-25.
A blue arrow denoting the difference between the figures for boys and girls in 2024-25 appears, with 5.9% in it.
Similar arrows for 2023-24 (6.4%) and 2018-18 (7.1%) appear on the screen at the appropriate places in the line chart.
Increases in activity levels compared to 12 months ago have been driven by children and young people from White and Mixed Backgrounds.
Nick slides off screen to the left and the line graph goes off to the right, replaced by a full-screen bar chart showing differences in figures by ethnicity.
The figures show % of active children and young people – the figures are:
- White British 51%
- White Other 53%
- Mixed 52%
- Asian 43%
- Black 41%
- Other 42%
Children and young people from Asian, Black and other ethnic backgrounds remain the least likely to be active.
And children and young people with two or more characteristics of inequality are the least likely to be active, with only 40% meeting the Chief Medical Officers’ guidelines.
The bar chart disappears, Nick reappears from the left and a line graph appears on the right showing data on levels of activity split by inequalities.
The chart compares 2023-24 to 2024-25 data, with those with 2+ characteristics of inequality in a flat line at 40%, while those with 0 characteristics, going up from 52% last year, to 54% this year.
A line then appears on screen for one characteristic, with that going up from 47% last year to 49% this year.
This is compared to 49% of those with one characteristic and 54% with no characteristics of inequality.
Activity levels in our priority places mirror those of England as a whole.
The graph leaves the screen to the left and Nick moves to the centre of the screen.
Children and young people who go to school in Place Partnership areas are equally likely to be active as those who go to school in other places we are working in, despite those places generally being more deprived, and facing greater inequalities.
Nick slides to the left of the screen and a new bar chart appears to the right denoting activity levels by place.
A red bar chart denoting the % of active people in our Place Partnership places appears, at 49%, with a blue one appearing next to it denoting all children and young people, also at 49%.
The results also show continued long-term growth in active travel and gym and fitness, reflecting ongoing changes in activity since the pandemic.
The bar chart slides off the right, replaced by a line graph denoting long-term trends for different types of activity.
Comparing 2024-25 results to 2017-18 results, a purple line shows gym/fitness increasing from 11% to 24% and a red line showing active travel going from 47% to 61%.
It also indicates a fairly static position for team sports and swimming, following a recovery in participation levels post-pandemic.
The graph in replaced by another line chart showing flat trends. Comparing data for the same ranges, a red line for team sports shows a relatively flat line, with some variation over time, from 56% to 58%. While a green line for swimming goes from 27% to 25%, with a steep decline during the years highlighted as being impacted by the Covid-19 pandemic, before recovering to 25%.
As ever our full report can provide more information on key areas including physical literacy as well as answers to broader wellbeing questions too.
The chart slides off to the right and is replaced by the animated paper report, with the cover page lifting to show the contents page, before closing to show the cover page.
And you can also access the detailed data tables, or visit the Active Lives Online tool on our website.
The report shrinks away, Nick disappears and the screen fades to blue, with a Sport England logo centrally placed in the bottom third of the screen, in white, with a white text box above it, in which appears sportengland.org/activelives